

Zero to $15 Billion
Earmarks vanished in 2025 and came back bigger than ever in 2026. Who actually won is not what most people assume, and the record is scattered across PDFs no one can read at once.
In 2025, members of Congress did all the work. They collected requests from the hospitals, ports, universities, and county governments in their districts. They vetted them, ranked them, and submitted them. By the time the process wound down, members had assembled roughly 13 billion dollars in community projects, each one attached to a real place and a real need.
Then all of it vanished. Congress could not finish its spending bills, passed a full-year continuing resolution instead, and that stopgap carried no earmarks at all. Every project that had cleared the process was zeroed out in a single vote.
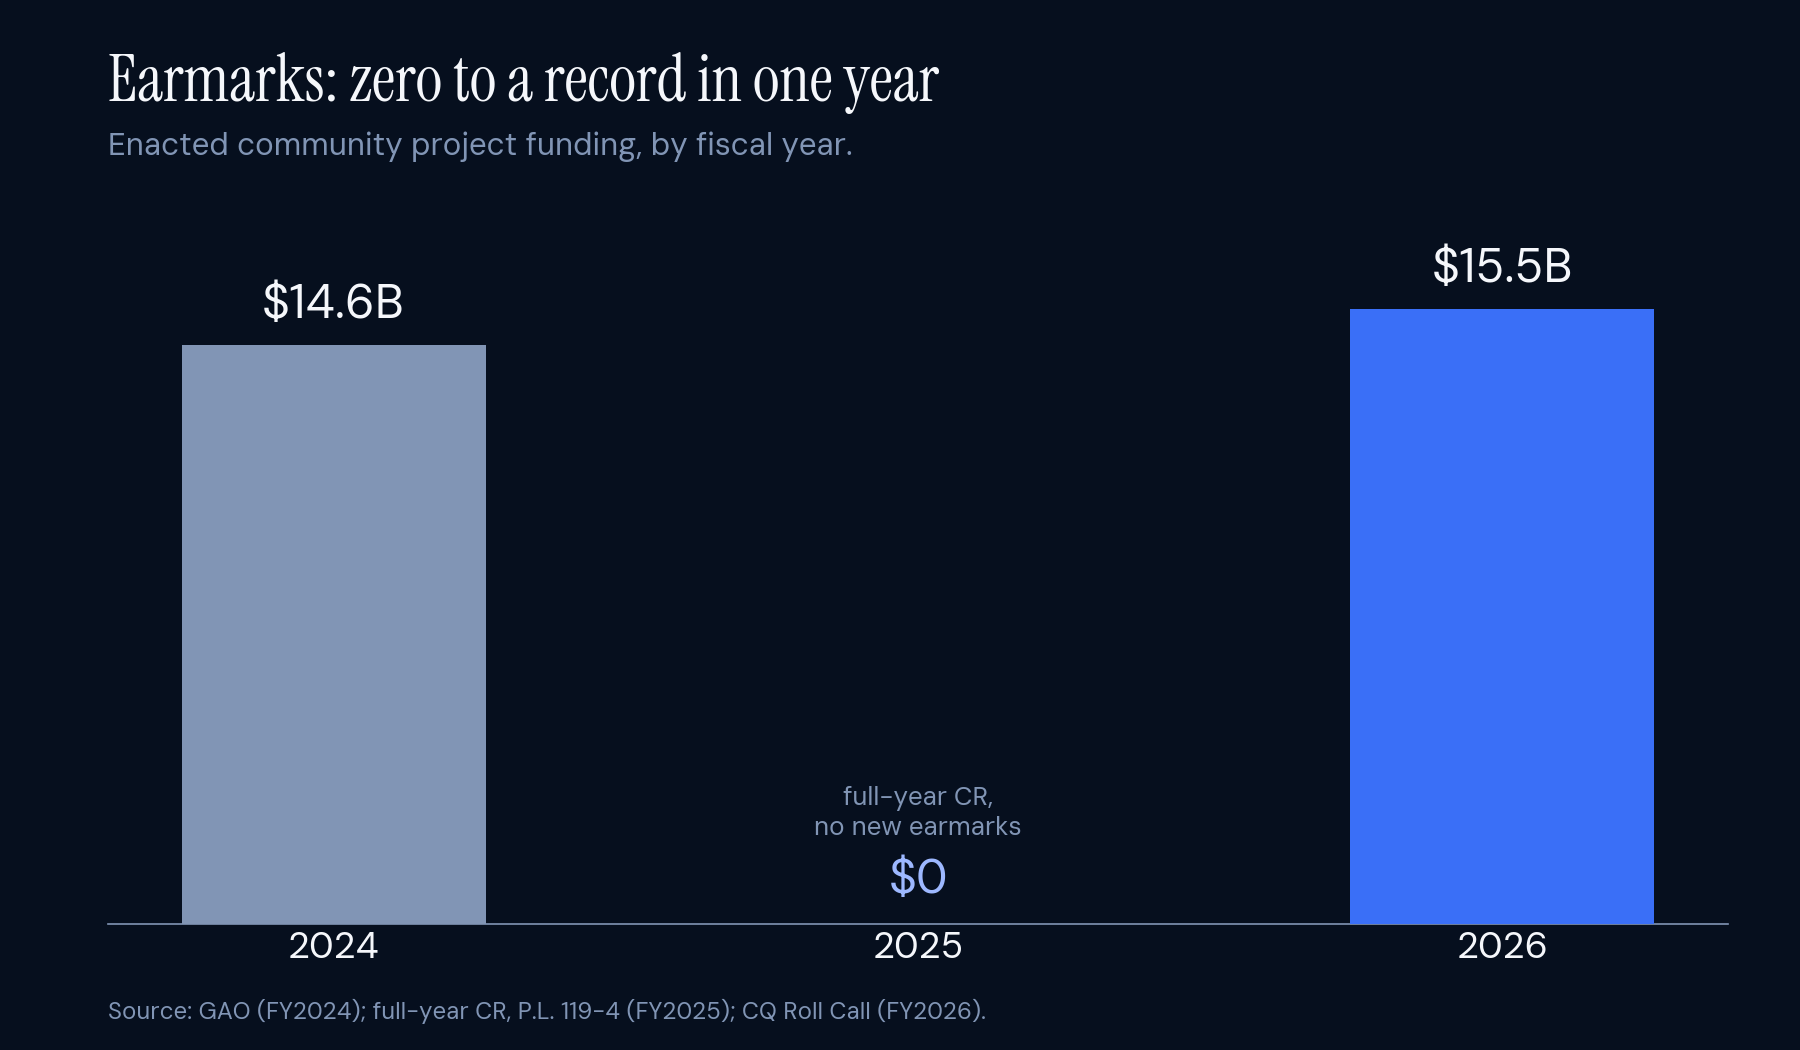
The swing is easier to see across three years than to describe. In 2024 the process ran about 14.6 billion dollars across roughly 8,100 projects. In 2025 it ran zero. Then across the fiscal 2026 bills enacted between November 2025 and April 2026, earmarks came back bigger than they had ever been, nearly 15.5 billion dollars of them. Zero to a record in twelve months is the clearest picture you will find of how far this process swings, and how much rides on reading it correctly.
The Pattern Nobody Names Out Loud
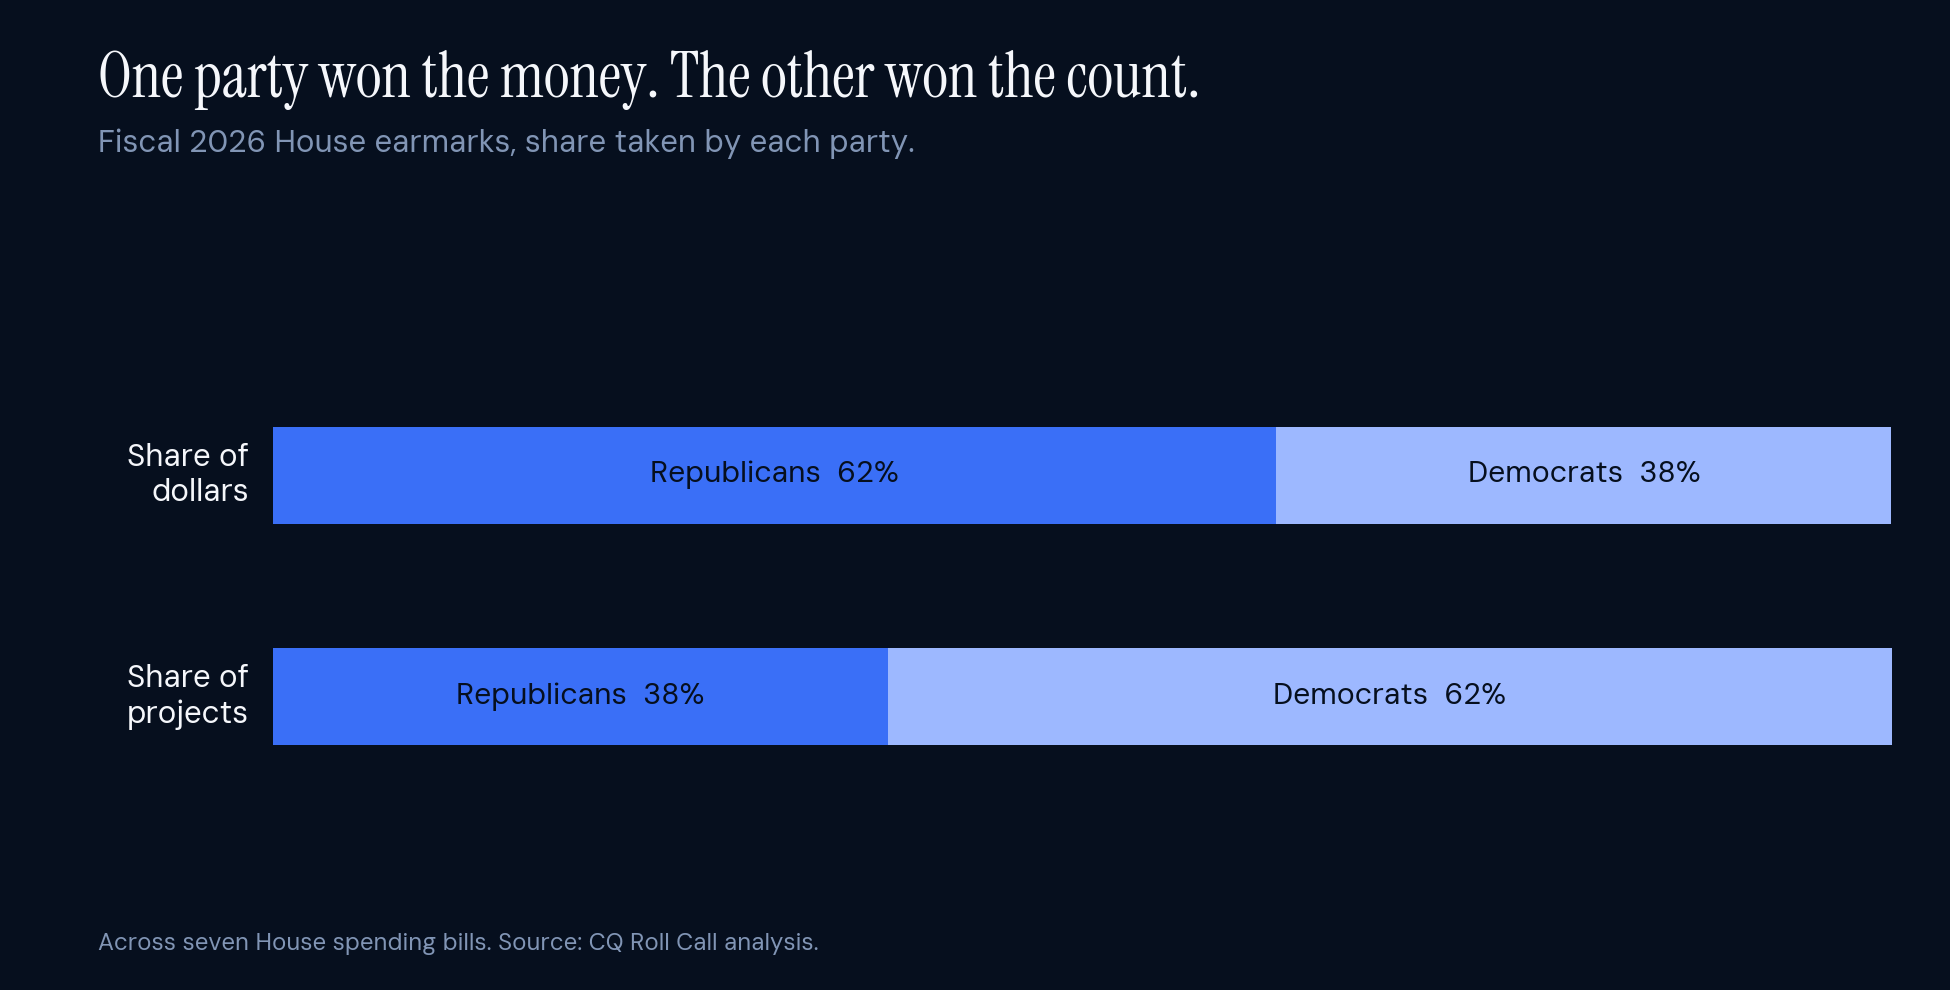
Here is the part that surprises people who assume earmarks are a tidy bipartisan split. In the fiscal 2026 House bills, Republicans claimed about 62 percent of the dollars, roughly 4.9 billion of just under 8 billion. Democrats, over the same bills, secured 62 percent of the individual projects, more than 5,000 of them.
Read that twice, because it is a clean inversion. One party won the money. The other won the count. More Democrats request earmarks, so the projects skew their way, but the dollars follow something else entirely.
They follow the gavel. The top of the fiscal 2026 earmark list is not a cross-section of Congress. It is a roster of the Appropriations Committee. The House leaderboard is led by the chairman of the Energy-Water subcommittee, Chuck Fleischmann. On the Senate side, the ranking member of Appropriations, Patty Murray, took the top spot, with the committee’s chair, Susan Collins, fourth. Seniority on the right subcommittee, not party talking points, is what turns a request into a wire transfer.
Where the Real Dollars Hide
Volume and value are not the same thing, and the gap between them is where most people misread the board. Transportation-HUD carries the most projects by a wide margin, thousands of them, which is where the attention goes. But the highest dollars per project sit in Energy-Water, where a few hundred earmarks carry billions, because that is where the Army Corps of Engineers projects live, single locks and dams worth more than entire slates of smaller grants elsewhere.
If you only count projects, you miss where the money is. If you only count dollars, you miss where the members are. You need both at once, connected, and almost nobody has them that way.
The Scavenger Hunt
Which brings us to the quiet problem underneath all of it. None of this data lives anywhere you can actually use.
The taxpayer watchdog that tracks earmarks most closely describes the disclosures as fragmented across inconsistently formatted committee PDFs, requiring extensive manual review. To build a usable list, its researcher copied the entries out of the committee documents page by page and rebuilt them into a clean table by hand. One of the group’s own reports is titled, with audible exhaustion, “Earmark Transparency Shouldn’t Be a Scavenger Hunt.”
That is the actual state of a 15 billion dollar process. The requests, the members, the accounts, the outcomes, all of it exists, all of it is technically public, and none of it is connected. Every question worth asking, which accounts convert requests into funding, which members move the biggest dollars, where a given project actually fits, has to be assembled from scratch, by hand, every single cycle.
Seeing the Whole Board
Fiscal 2027 requests are being assembled right now, in the same PDFs, under the same fragmented process. The teams working them are asking the old question: who can find me the committee table for the accounts my client cares about.
The better question, the one the data can answer once it is structured, is a different kind of question. Where do requests actually convert to dollars? Which subcommittee gavels control my client’s account? Who are the members that move real money, not just real project counts? And what did the last cycle teach that this one should not have to learn again from a blank page.
The zero year proved how fast this process can erase a year of work. The rebound proved how much money runs through it when it moves. The one thing that has not changed is that the people who can see the whole board at once, while the cycle is live, will always be a step ahead of the people still turning PDF pages.
Sources: U.S. Government Accountability Office, GAO-25-107549 (FY2024 totals); Full-Year Continuing Appropriations Act, 2025 (P.L. 119-4) and Congressional Research Service and Committee for a Responsible Federal Budget analyses (FY2025); CQ Roll Call (FY2026 enacted totals, party split, and top earmarkers); Washington Examiner (House request totals); National Taxpayers Union Foundation (earmark tallies and disclosure fragmentation).